Nearly one out of every nine bridges in the United States is deemed structurally deficient and potentially dangerous, according to the Federal Highway Administration. It would cost an estimated $70 billion to catch up with the nation’s backlog of nearly 70,000 bridges in need of repair.
However, a UNL associate professor has developed a data management tool that could help officials monitor deteriorating bridges and prioritize their repair.
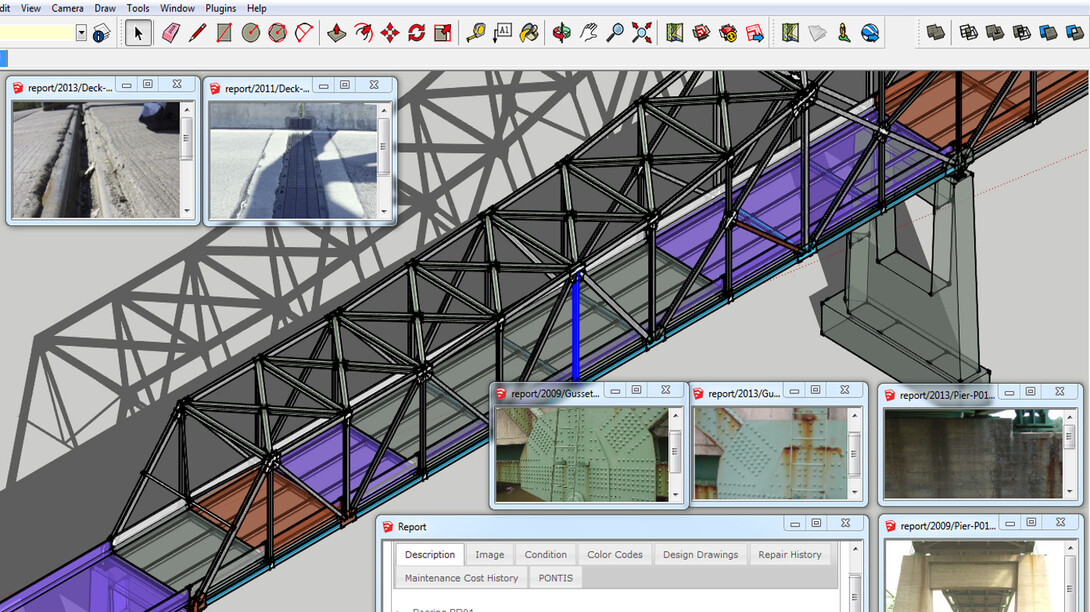
With a grant from the Nebraska Department of Roads, Zhigang Shen and his student research assistants built a 3-D computer model of the Mormon Bridge, where Interstate 680 crosses the Missouri River near Omaha. The model allows engineers, with a click of a mouse, to identify which parts of a bridge need fixing.
“Bridge management, bridge conditions and infrastructure are very big issues,” Shen said. “This represents a paradigm shift in terms of data management.”
The tool is based on Building Information Modeling, software used to draft three-dimensional, detailed architectural plans for buildings and their various mechanical, electrical and structural systems.
Wayne Jensen, an associate professor of construction management who has worked with the Department of Roads for several years, is a co-investigator in this project.
Nebraska law requires bridges to be inspected every two years, with inspectors rating and photographing the condition of each component. Analyzing that data to determine the extent and pace of deterioration can be cumbersome and unwieldy.
“When you look at their system and you call up a particular bridge or a particular section of road, you end up with a series of numbers in a spreadsheet,” Jensen said. “If you don’t know what you’re looking at, your computer screen is filled with numbers that don’t mean anything. Zhigang and I thought it would be cool to take the information in the spreadsheets and actually do a model of the bridge.”
They chose the Mormon Bridge, because the truss bridge is one of the most complicated bridges in Nebraska, with several hundred elements.
The model color-codes each component of the bridge according to its inspection — green is in good condition, yellow requires monitoring, red means repairs are needed. Clicking on a particular component brings up inspection reports as well as photos of cracks, corrosion or other damage. Several years can be compared to determine the rate of deterioration.
Nebraska’s state bridge engineer, Mark J. Traynowicz, and assistant bridge engineer Fouad A.H. Jaber said they think roads officials across the country would find the system useful, particularly those who have many big or complicated bridges to manage.
“It’s a good product to see how our bridges are aging and how they’re holding up,” Traynowicz said. “If and when we have to make some repairs, it’s a little easier to see what goes with what.”
Jaber said Shen’s system is not intended for sophisticated dynamic structural analysis being developed elsewhere in the country.
Shen, who said his work was partly inspired by the 2007 collapse of a Mississippi River bridge in Minneapolis, is proposing to include sensors in his system. Even without sensors, the bridge engineers said Shen’s system may be a cost-effective way for cash-strapped state and local governments to monitor bridge conditions.
“When you get sensors, you get data, and you need someone with the training to interpret the data,” Jaber said. “It depends on your resources.”
Shen said he is beginning to get inquiries as word spreads about his project. He said he hopes to interest the Federal Highway Administration in his system.


