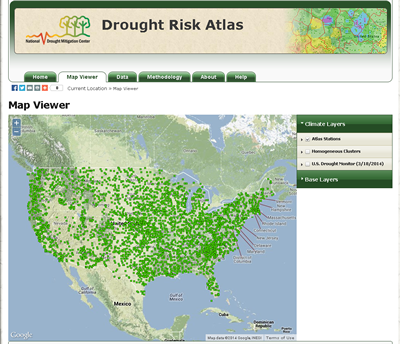
The National Drought Mitigation Center, based in UNL’s School of Natural Resources, has unveiled a new online Drought Risk Atlas that provides analysis of data on drought frequency and severity for more than 3,000 spots across the country.
“The Drought Risk Atlas contains more than 3,000 of the best climate record stations in the U.S. and houses more than 1 billion records of index calculations alone,” said Mark Svoboda, climatologist, leader of the NDMC’s monitoring program area and SNR geoscientist.
The stations chosen for the atlas go back at least 40 years with nearly continuous data, and some go back more than 100 years.
Users can find the closest climate station and see how often drought has affected an area, how bad it has been and how long it lasted, Svoboda said.
They can look at drought through the lens of several different indices, including the U.S. Drought Monitor, the Standardized Precipitation Index (with and without evapotranspiration), the Palmer Drought Index, deciles and more. They can also choose to look at records for a cluster of stations that are near each other that exhibit similar historic patterns of drought.
Svoboda said that the data go through 2012 and contain both raw and serially complete datasets for the user to choose from. Users can download the data. The NDMC worked with the High Plains Regional Climate Center, also based in SNR, to incorporate data from the Applied Climate Information System.
“It’s a giant set of quality-controlled data with a large time spread and a bunch of different indices to compare,” said Chris Poulsen, the drought center geospatial analyst involved in crunching the numbers. “I don’t know that there’s another accessible dataset out there for drought. This is a set of data that’s complete and QC’d back to 1900 and further.”
Why have a drought risk atlas?
“Whenever there is a drought, people want to know how it compares with past droughts,” Svoboda said. “Until now, that information hasn’t been readily available for a given climate station. We heard from stakeholders about the questions they needed answered.”
Stakeholders include agricultural producers, agency personnel and planners.
“We hope it will lead to a more informed, better decision-making process, bringing it down to a producer-level scale,” said Brian Fuchs, the NDMC climatologist and SNR assistant geoscientist who worked extensively on the atlas. “Users of various levels of expertise and needs can go in and quickly find information about drought history and frequency for any part of the country. It also gives users the ability to compare various drought indices quickly and see which ones work better in their area.”
The drought atlas may at first seem complex. Jeff Nothwehr, GIS and Web specialist who developed the website for the atlas, advised users visiting the site for the first time to have a goal in mind, such as learning record high and low temperatures for a given location, and to start with the help page if they feel overwhelmed.
Svoboda credited the U.S. Department of Agriculture’s Risk Management Agency, the National Integrated Drought Information System and the National Oceanic and Atmospheric Administration’s Sectoral Applications Research Program with supporting development of the atlas.
Even though, where climate is concerned, the past is considered a less reliable guide to the future than it used to be, the Drought Risk Atlas can help researchers better anticipate future climate impacts, Svoboda said.
“We’re not done just because we launched the Drought Atlas,” he said. “This is a tool to help researchers, decision makers and the public better understand droughts and their behavior. We can also use it to identify changes in drought behavior patterns.”