The global emergence of climate change should get farmers thinking and acting locally, according to nearly a half-century of data analyzed at the University of Nebraska-Lincoln.
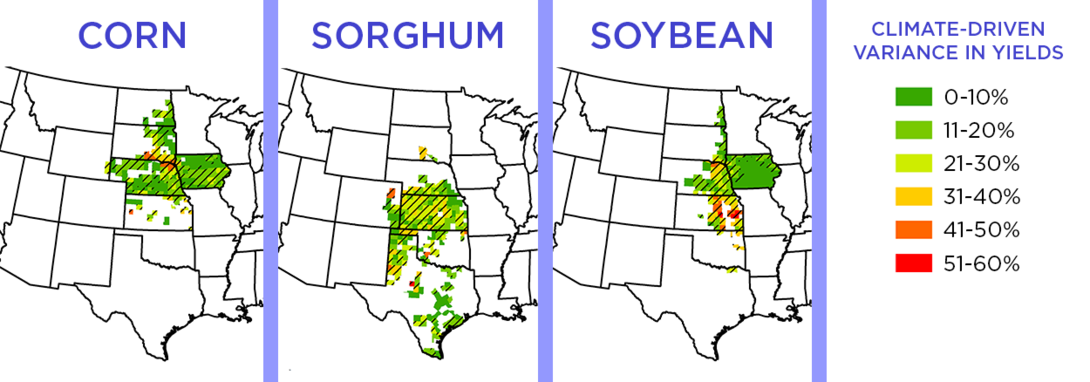
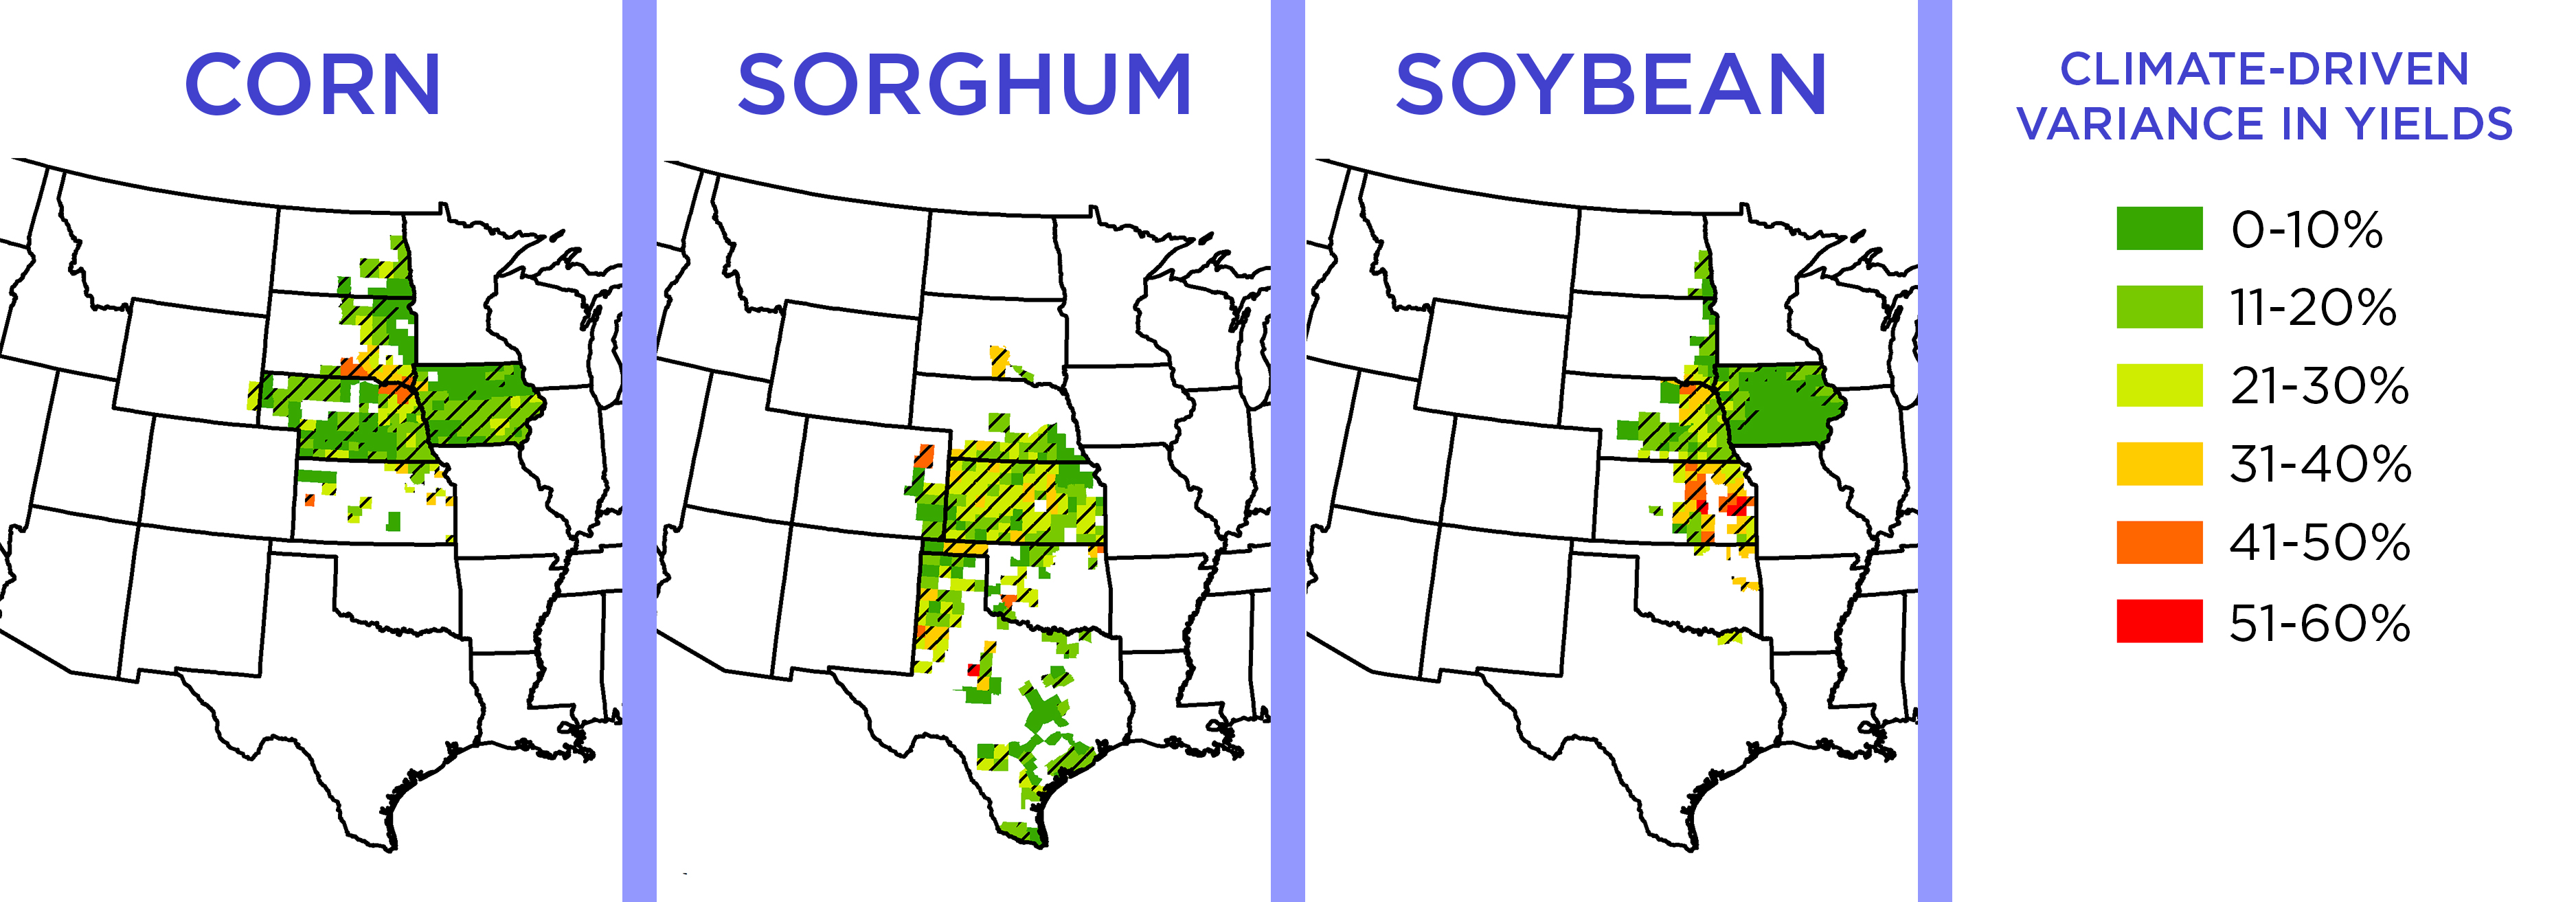
The new Nebraska study suggests that climate shifts between 1968 and 2013 drove about 25 percent of the collective fluctuations in corn, soybean and sorghum yields across the Great Plains.

But the magnitude and direction of those climatic effects often differed within a state, sometimes even across neighboring counties. In certain counties, temperature and precipitation shifts accounted for up to 52 percent of the variance in crop yields; in others, those factors seemed to have virtually no effect. The study further found that corn, soybean and sorghum responded differently to similar changes in climate factors.
“People talk a lot about global climate change and continent-level change,” said senior author Suat Irmak, Eberhard Distinguished Professor of biological systems engineering. “Quantifying what’s happening globally is great, but we cannot generalize that to everywhere. We need to go into more local areas to look at those interactions so that effective region- or location-specific methods and strategies can be developed.”
“We have average, aggregated numbers over the (whole) region,” Kukal added, “but it’s always better to look at finer scales when possible.”

The study’s findings could help guide the allocation of vital but limited resources, Irmak said, including the aquifer-derived water used to irrigate crops. Because some areas of a state produce far greater yields than do others, even moderate shifts of temperature or precipitation in those areas could substantially affect the food and fuel production of an entire state or even a region, he said.
Whereas precipitation shifts explained the sorghum variance in just 17 percent of counties, for instance, those counties produced 49 percent of the sorghum in the Great Plains. And though only 18 percent of counties could pin their soybean variance on precipitation shifts, those counties produced 32 percent of the region’s soybean.
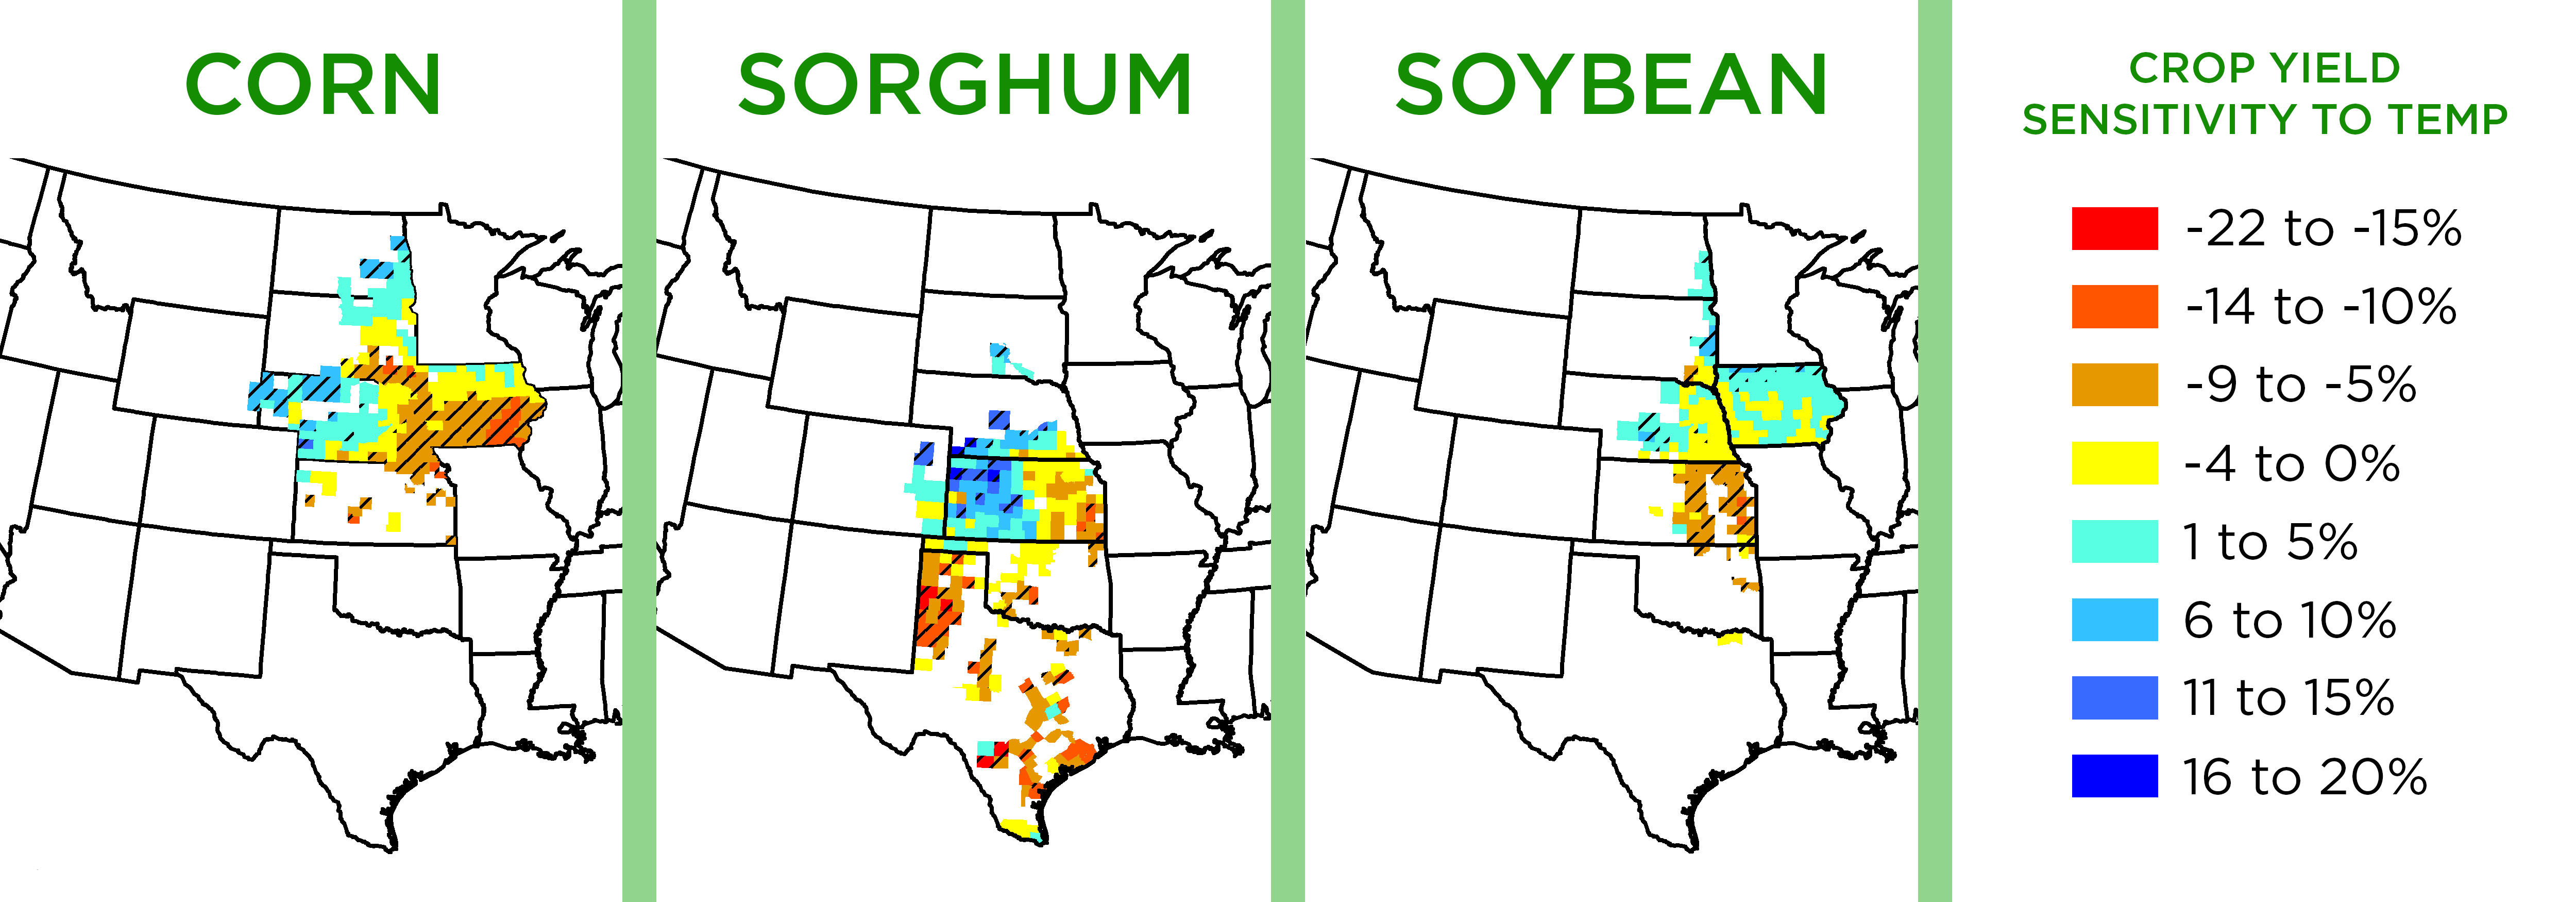
The three crops showed varying degrees of sensitivity to temperature increases, which occurred in 578 of the 834 counties. Irmak and Kukal concluded that corn – followed by soybean, then sorghum – is most susceptible to rising temperatures. Despite this – and further emphasizing the importance of county-level analysis – the researchers found that more counties actually saw their corn yields increase rather than decrease under a warming climate. How? Corn was often irrigated, which seemed to more than offset the potential effects of rising temperatures. Non-irrigated corn was roughly twice as sensitive to temperature increases, the study reported.
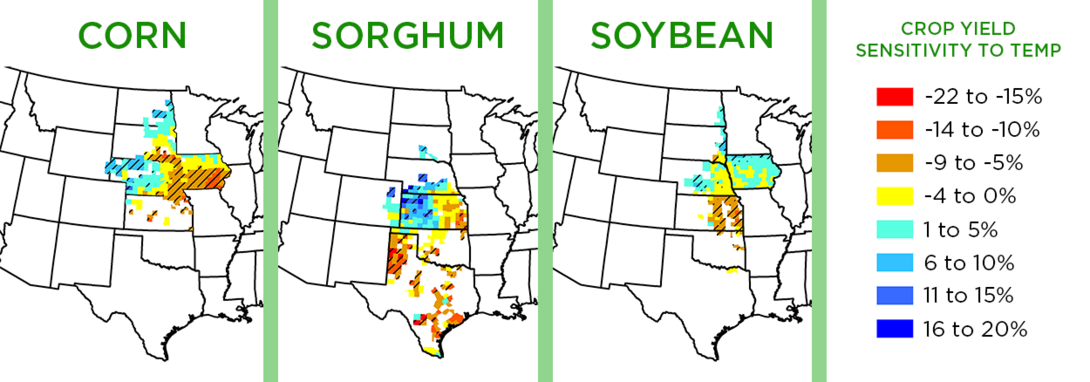
This buffering effect of irrigation, which aligns with prior research, also appeared when examining overall yields. The variance in yields of non-irrigated corn, sorghum and soybean was 77, 69 and 63 percent higher, respectively, than their irrigated counterparts.
Changes in climate accounted for just 8 percent of the yield variance in irrigated corn vs. 41 percent of non-irrigated corn; 4 percent vs. 35 percent of soybean; and 9 percent vs. 23 percent of sorghum. Yet the interactions between precipitation and irrigation differed among the crops: Non-irrigated corn was 43 times more sensitive than irrigated corn to shifts in precipitation, whereas non-irrigated soybean and sorghum were only about three times more sensitive.
Those nuances illustrate the value of collecting local data that accounts for different climate variables, crop types and growing conditions, the researchers said.
“I hope we are successful in getting across the message that there are changes in temperature and precipitation, (but) those changes are different over time and location, and they are having different impacts on our agricultural productivity,” Irmak said. “That can help high-level advisers, decision-makers and policymakers to identify locations where those impacts are greatest so that resource allocation or re-allocation can make (fields) even more productive.
“Our agricultural productivity has national implications on the economy, on jobs, on social issues – these are really important and big topics. I hope they take home the message that things are changing, and we need to be proactive and pay attention to those so that we can sustain our productivity.”
Irmak and Kukal reported their findings in the journal Scientific Reports.
Share
News Release Contact(s)
Related Links
Tags
High Resolution Photos

HIGH RESOLUTION PHOTOS

HIGH RESOLUTION PHOTOS
HIGH RESOLUTION PHOTOS
HIGH RESOLUTION PHOTOS